
Evening all.
Yesterday the markets displayed some strange behaviour with the ‘Triple Whammy’ I wrote about last night and that certainly ended up being a portend for a bad day, with the Dow having its worst day since the 1987 flash crash.
I usually use the SP500 for looking at the broader US market but with the Dow making the news today I thought I’d see what’s happening with it. There are 3 things of interest that jumped out for me and I’m wondering if there might be a glimmer of hope that this sell-off could abate soon.
- Several analysts have been talking about the idea that the SP500 needs to come back and test the December 2018 low and I started to get used to that idea. With the move on the Dow today, it smashed straight through that low, as I’ve highlighted with the Yellow horizontal line on the chart.
- The area price finished today is right in the zone of where the Dow went into a steep rally following the inauguration of President Trump and his subsequent moves to cut taxes and regulation for businesses in the US. This represent a complete unwind of the market rally enjoyed and trumpeted by President Trump in showing how great the US economy is and how great a President he is.
- There is a trendline that can be drawn for the Dow which presents a technical support that is about 1,000 points away at this stage. A 1,000 points on the Dow used to be a big deal but at the moment that kind of move can happen in a couple of hours. I’ve drawn that potential trend on the chart and it would also give a more complete unwind of move I mention in point 2.
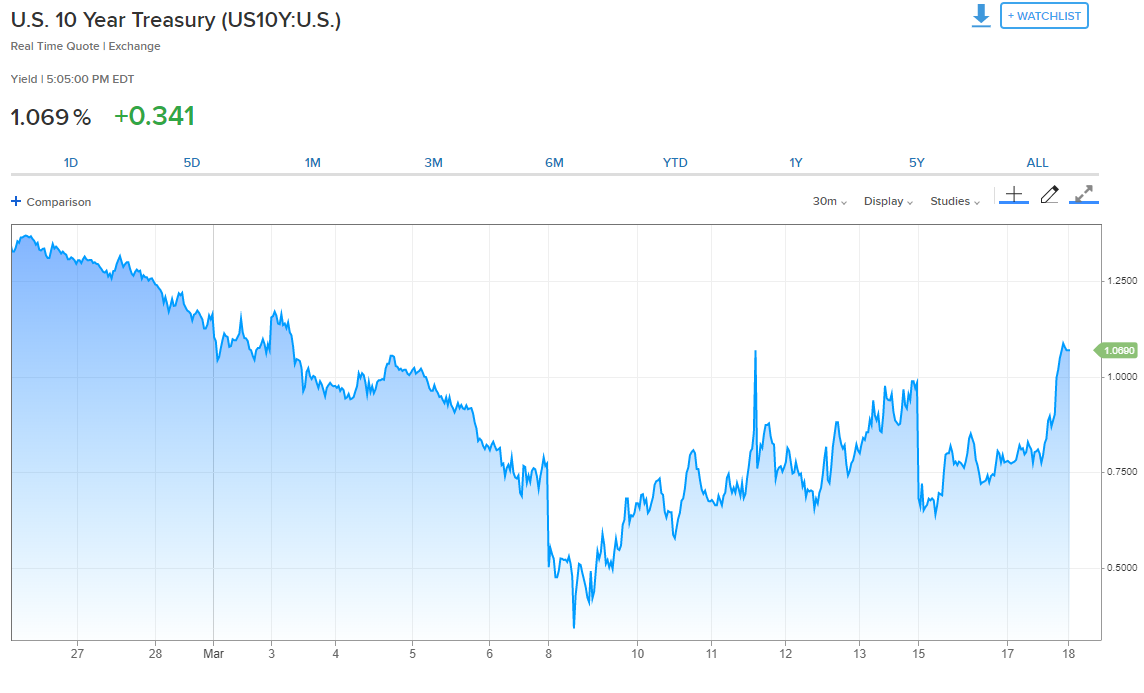
We can add to this some strange moves in the markets with Gold down yet again today and some weird bond action with 10yr and 20y US bonds not doing anything in sync.
Why does this matter? Well similar to yesterday, these moves out-of-correlation could be indicating that asset selling is being forced by account factors such as margin-calls, rebalancing needs and drawdown covenants. This kind of selling is more likely to be episodic rather than sustained, and once account issues have been resolved the pressure on these asset classes could ease. Maybe watching the VIX, which went crazy high today can offer some confirmation of this if it starts to normalise.
It’s impossible to call a bottom and I’m not looking to do so, but I figure that each time something can be added to the list of reasons that selling could be exhausting itself, it helps encourage the bulls and maybe tempt a few bears to cover some exposure.
I did deploy a bit more capital today as SOXX went through the 25% correction level and then later AMD went through the 30% correction level and I added to that one too. It’s not comfortable buying into these kind of historic market falls but with the SP500 only being a few percent away from the 30% correction level, and not far from the 2018 lows, I’m willing to continue with the plan and scale into the market during this period where I really feel ‘peak-fear’ is playing out.
With it being Friday tomorrow it will be interesting to see how the big money decides to act into the unknowns of another weekend where they can’t react to news or government/central bank actions.
Thanks for your time.


